Skip to content
Indoor Air Quality 

Improve Air Quality at Home, Office & Industry

by Jeet Sodagar on 16/11/26

Introduction

We check the weather before stepping out. Far fewer of us check the air we breathe indoors, even though that is where most of the day goes. US EPA research finds people spend about 90% of their time indoors, where some pollutants run 2 to 5 times higher than outdoors, and occasionally over 100 times higher [1]. That is US data, but a sealed meeting room, a smoky kitchen or a dusty shop floor behaves the same way anywhere.

In short

  • India’s air pollution burden is huge: about 2 million deaths were linked to it in 2023 [2] [3].
  • In offices and homes, stale air (high CO₂), VOCs and fine dust go with headaches, tiredness, poor focus and throat and nose irritation.
  • In factories, dust and fumes drive COPD and silicosis. The proven order of action is: control it at the source, measure it, and use protective equipment last.
  • You cannot manage what you do not measure. Compact monitors give early warning indoors; continuous ambient monitors cover plants, sites and cities. 

1. India’s air in numbers

WhatThe NumberSource
India’s average PM2.5, 202548.9 µg/m3, nearly 10 times the WHO annual guideline of 5 µg/m3IQAir World Air Quality Report 2025 [4] [5]
Global ranking6th most polluted of 143 countries; 66 of the world’s 100 most polluted cities are in India[5]
Deaths linked to air pollution, 2023About 2 million; 186 per 100,000 people, versus 17 in high-income countriesState of Global Air 2025 (HEI/IHME) [2] [3]  
COPDMore than two-thirds of India’s COPD deaths are attributable to air pollution[3]
Economic cost, 2019US$36.8 billion, or 1.36% of India’s GDPLancet Planetary Health, ICMR-supported study [6]  
NO20 – 50 ppm0.1 ppm
HCL0 – 30 ppm0.1 ppm
H20 – 2000 or 2%1 ppm or 0.01%
ASH3 or PH30 – 1 ppm0.1 ppm
NH30 – 100 or 1000 ppm1 ppm
CLO20 – 1 ppm0.01 ppm
HF0 – 10 ppm0.01 ppm

India’s legal limits are also looser than WHO’s health-based guidelines, so air can be “within norms” and still above what WHO considers safe:

PollutantIndia CPCB NAAQS (annual / 24-hour)WHO 2021 guideline (annual / 24-hour)
PM2.540 / 60 µg/m3 [7] 5 / 15 µg/m3 [8]
PM1060 / 100 µg/m³ [7] [5]

What bad air does to people at work and at home

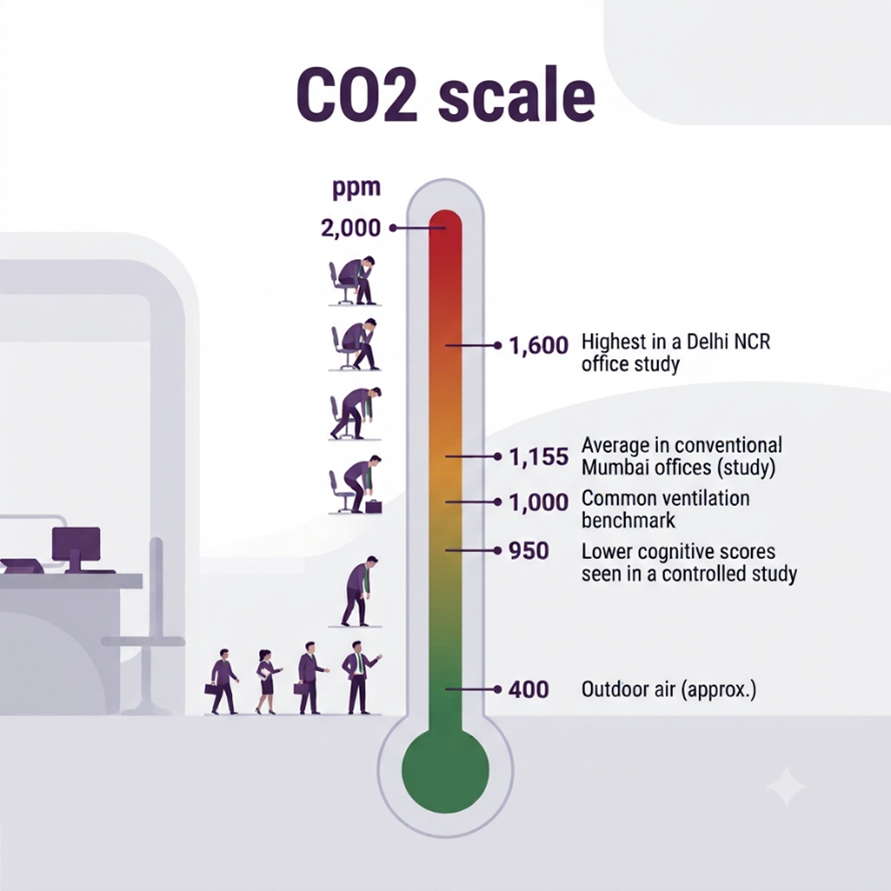
office co2 level graph

In Offices

Delhi NCR: a study of four air-conditioned office buildings found PM₂.₅ up to 116.5 µg/m³ (winter monitoring) and CO₂ up to about 1,600 ppm. Every building exceeded the NAAQS and ASHRAE benchmarks used in the study [9]. 

Mumbai: across 10 commercial office buildings, 53% of surveyed employees in conventional buildings met the criteria for sick building syndrome, versus 38% in green-certified ones (the gap was not statistically significant). Reported symptoms in conventional buildings included lethargy (48%), headache (44%) and mental fatigue (41%); sore throat, cough and runny nose were each reported by roughly 27–36% of staff. Average CO₂ was 1,155 ppm in conventional buildings versus 824 ppm in green buildings [10]

Focus: in a controlled Harvard-led study of 24 office workers, cognitive test scores were 61% higher under low-VOC “green” conditions and 101% higher with low VOCs plus extra ventilation than under conventional high-VOC conditions. Scores also dipped when CO₂ rose to about 950 ppm, a level common indoors. It is a small study, but the direction is consistent with the symptoms above [11]. 

At home

  • Globally, household air pollution, mostly smoke from cooking with polluting fuels, caused an estimated 3.2 million deaths in 2020 [12]. 
  • In India, 0.61 million of the 1.67 million air-pollution deaths in 2019 came from household air pollution. Its death rate has fallen 64% since 1990, while the death rate from outdoor particulate pollution rose 115% [6]. 
  • Urban homes add their own sources: building materials, furnishings, personal care products, pesticides and cleaners, plus dust that drifts in from outside [13]. 

In factories and on sites

  • WHO and ILO estimate that workplace exposure to particulates, gases and fumes caused about 450,000 deaths (from COPD) in 2016, the second-largest occupational killer after long working hours [14]. Exposed workers face a 58–182% higher COPD risk than unexposed workers [15]. 
  • In India, studies of silica-exposed workers in Gujarat report silicosis in 18% to 69% of agate workers and about 15% of pottery workers [16]. The disease is irreversible, often misdiagnosed as TB, and fully preventable [17]. 

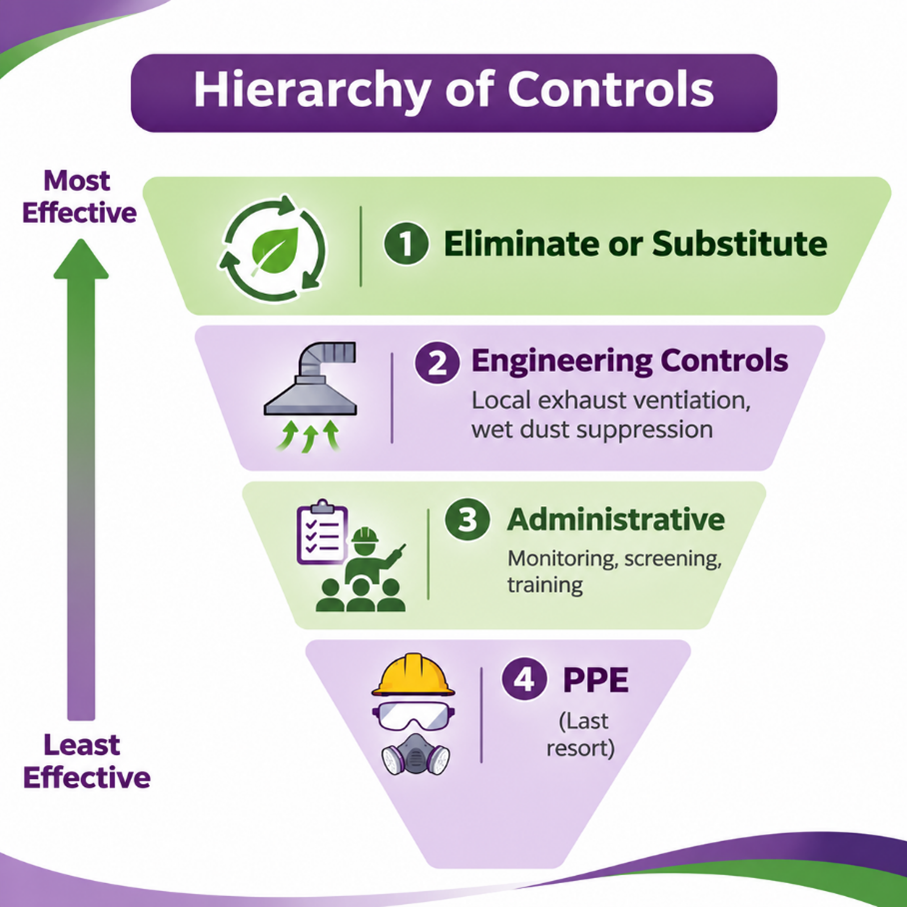
hierachy of controls

How to improve air quality at home and in the office

  • Ventilate, but ventilate smartly. Outdoor air dilutes indoor pollutants. A multidisciplinary review of 27 studies linked higher office ventilation rates (up to about 25 litres per second per person) with fewer sick-building symptoms, and lower rates with more respiratory infections, asthma symptoms and short-term sick leave [18]. CO₂ is the easy proxy: the Mumbai study above used 1,000 ppm as its benchmark [10]. One catch: where outdoor air is itself polluted, pair ventilation with good filtration instead of relying on open windows alone. The same review notes that evidence from polluted-air locations is still thin [18]. 
  • Cut pollution at the source. Furnishings, cleaning products, pesticides and building materials all emit VOCs [13]. Choose low-emission products, keep chemicals sealed, and ventilate cooking directly. For households that still cook on polluting fuels, WHO’s priority is a switch to clean fuels and technologies [12].
  • Filter particles. A Lawrence Berkeley National Laboratory review found filtration gives modest benefits for allergy and asthma symptoms, but modelling suggests the biggest payoff is cutting indoor exposure to particles that come from outdoor air [19]. In a polluted city, a well-fitted particle filter sized for the room is worth it. Avoid air cleaners that emit ozone, which EPA lists among indoor pollutants [13].
  • Do not count on houseplants. The idea that plants purify air comes from sealed-chamber experiments. A Drexel University review of 12 studies calculated that you would need roughly 10 to 1,000 plants per square metre of floor to match normal ventilation [20]. Keep plants for looks, not for air cleaning.

  • Measure. Most of us cannot judge CO₂, fine dust or VOC levels by feel. A monitor turns “the room feels stuffy” into a number you can act on.

Where an indoor monitor helps

ESPM Sense’s MiKro series is built for exactly this: compact, wall-mount or table-top monitors with a configurable 85 dB audible and visual alarm, a clear OLED display and USB-C charging. 

MiKro-S tracks CO₂ (NDIR), VOC, an IAQ index, humidity and temperature, a good fit for offices, classrooms, clinics and homes.

MiKro-PM adds PM₁, PM₂.₅ and PM₁₀ (laser scattering) alongside CO₂, VOC, IAQ, humidity and temperature, with a choice of two gases (O₂, CO or LPG) and optional micro-SD data logging.

A fair word on limits: low-cost sensors are best used as indicators for spotting trends and triggering action. Independent testing shows they can drift and are affected by humidity and other gases [21], so use calibrated reference methods wherever legal compliance is involved. 

How to improve air quality in industries

WHO and ILO guidance on workplace air pollution runs in a clear order: dust control, ventilation, and protective equipment as a last resort [24].


1. Stop dust at the source. Wet methods and local exhaust ventilation (LEV) are the workhorses. A review of silica and dust controls found they deliver substantial exposure reductions [22], and a UK Health and Safety Executive review reports reductions of up to about 90% for on-tool controls [23].

2. Do not stop there. Even a 90% cut does not eliminate exposure, so respiratory protection may still be needed, especially around silica [23]. For respirable quartz, controls alone may not reach the recommended limit of 0.05 mg/m³ [22].

3. Protect and screen workers. India-focused research argues for stronger surveillance and health programmes for silica-exposed workers, since silicosis is commonly mistaken for TB [16] [17].

4. Monitor continuously. Filters clog and processes change, so yesterday’s fix can fail quietly. Continuous ambient data shows hot spots, proves trends and gives early warning to the people who can act. IQAir’s 2025 report makes the same point: without monitoring, we cannot fully understand what is in the air [4]. 

Where a continuous ambient monitor helps

For plants, mines, construction sites, ports, industrial estates and city locations, ESPM Sense’s SAM-X Smart AQI Monitor is designed for continuous outdoor monitoring, installed open to sky in an IP66 enclosure (wall, pillar or pole mount).


  • Choose what you measure: PM₁, PM₂.₅, PM₁₀; gases such as CO, SO₂, NO₂, O₃, NH₃, H₂S, HCl, Cl₂, CO₂ and VOCs; plus humidity, temperature, pressure, light, UV and noise. Meteorological measurements can be added.
  • Active sampling at 1 L/min, stated accuracy of ±2% at constant temperature, and a response time generally under 10 seconds (varies by gas).
  • See it on site and online: a 240 × 128 graphical display with AQI LED indication, plus the built-in DMS-X IoT module for a cloud dashboard with map view, alarms, email and SMS alerts, FTP and MODBUS RTU (RS485).
  • Power options: 230 VAC, with optional battery backup and, on the appropriate variant, a solar panel for remote poles. 

Sources (where each number came from)

01. US EPA, Questions About Your Community: Indoor Air (90% of time indoors; indoor levels 2–5×, occasionally over 100×): https://archive.epa.gov/region1/communities/web/html/indoorair.html

02. Health Effects Institute / IHME, State of Global Air 2025 (India and China each over 2 million deaths in 2023): https://issuu.com/ihme/docs/state_of_global_air_2025 

03. Down To Earth coverage of SoGA 2025 (186 vs 17 deaths per 100,000; COPD share): https://www.downtoearth.org.in/air/air-pollution-damaging-brain-health-worsening-disease-burden-in-india-soga-2025

04. IQAir, World Air Quality Report 2025 press release (143 countries, WHO guideline 5 µg/m³, importance of monitoring): https://www.iqair.com/au/newsroom/waqr-2025-pr 

05. Drishti IAS summary of the IQAir 2025 report (India 48.9 µg/m³, 6th rank, 66 of top 100 cities): https://www.drishtiias.com/state-pcs-current-affairs/world-air-quality-report-2025/print_manually 

06. Pandey et al., Lancet Planetary Health 2021, GBD 2019 India (1.67 million deaths, 0.61 million household, US$36.8 billion): https://pubmed.ncbi.nlm.nih.gov/33357500/ and https://doaj.org/article/daf693fd3a3d444b9df48695cb72a342 

07. CPCB NAAQS values (via Indian Economic Service Arthapedia): https://ies.gov.in/arthapedia/concept/ambient-air-quality-standards-india 

08. WHO 2021 Air Quality Guidelines table (via Air Pollution & Climate Secretariat): https://www.airclim.org/who-air-quality-guidelines 

09. Gupta et al. 2020, PM2.5 and CO2 in Delhi NCR offices: https://rd.springer.com/chapter/10.1007/978-981-15-1334-3_8 

10. Gawande et al. 2020, Indian J Occup Environ Med, Mumbai office buildings and SBS: https://pmc.ncbi.nlm.nih.gov/articles/PMC7227732 

11. Allen et al. 2016, Environmental Health Perspectives, cognitive scores, CO2 and VOCs: https://pubmed.ncbi.nlm.nih.gov/26502459/ 

12. WHO, household air pollution health risks (about 3.2 million deaths): https://www.who.int/teams/environment-climate-change-and-health/air-quality-and-health/sectoral-interventions/household-air-pollution/health-risks 

13. US EPA Report on the Environment, Indoor Air Quality (sources, ozone from air cleaners): https://19january2021snapshot.epa.gov/report-environment/indoor-air-quality_.html 

14. WHO/ILO Joint Estimates of work-related burden of disease, 2000–2016: https://www.who.int/news-room/questions-and-answers/item/total-who-ilo-joint-estimates-of-the-work-related-burden-of-disease-and-injury--2000-2016 

15. SciDev.Net on the WHO/ILO estimates (COPD risk up 58–182%): https://www.scidev.net/global/news/long-hours-a-key-cause-of-work-related-deaths/ 

16. Silicosis in India: challenges and control (Gujarat agate and pottery prevalence), J Occup Med Toxicol: https://pmc.ncbi.nlm.nih.gov/articles/PMC10337186 

17. Same paper at the publisher (silica exposure is fully preventable; frequent TB misdiagnosis): https://link.springer.com/article/10.1186/s12995-023-00379-1 

18. Sundell et al. 2011, Indoor Air, ventilation rates and health review: https://pubmed.ncbi.nlm.nih.gov/21204989/ 

19. Fisk 2013, Indoor Air, health benefits of particle filtration: https://eta-publications.lbl.gov/publications/health-benefits-of-particle-filtration 

20. Cummings and Waring 2019, J Expo Sci Environ Epidemiol, potted plants: https://www.nature.com/articles/s41370-019-0175-9 (press summary: https://drexel.edu/news/archive/2019/november/potted-plants-do-not-improve-air-quality) 

21. Karagulian et al. 2019, Atmosphere, performance of low-cost sensors: https://mdpi.com/2073-4433/10/9/506 

22. Flynn and Susi 2003, Appl Occup Environ Hyg, engineering controls for silica and dust: https://pubmed.ncbi.nlm.nih.gov/12637237/ 

23. UK HSE RR926, on-tool controls for respirable dust: https://www.hse.gov.uk/Research/rrhtm/rr926.html

24. The Himalayan Times on the WHO/ILO release (dust control, ventilation, PPE as last resort): https://thehimalayantimes.com/business/almost-2m-people-die-from-work-related-causes